
Graphical Representation of Motion
Graphical Representation of Motion: Overview
This topic covers concepts such as Graphical Representation of Motion, Distance-time Graphs, Slope of Distance-time Graphs, Velocity-time Graphs, Area under Velocity-time Graphs, and Slope of Velocity-time Graphs.
Important Questions on Graphical Representation of Motion
_____ of a body within a definite interval of time is equal to the area of the portion under velocity-time graph.
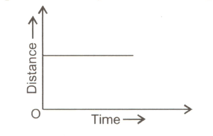
Following graph represent a body moving with constant velocity.
When graph has _____ slope, acceleration is negative.
The graph given below represents _____.
A car of mass is moving with a velocity of . If the velocity-time graph for this car is a horizontal line parallel to the time axis, then the velocity of the car at the end of will be:
The physical quantity which is represented by the area under the line of velocity-time graph is _____.
When graph has negative slope, acceleration is:
_____ of a body within a definite interval of time is equal to the area of the portion under velocity-time graph.
When will be the slope of velocity-time graph be zero?
A car travels in the same speed in the same direction for a time . Draw the velocity-time graph of the same.
Negative slope of a v-t graph signifies _____.( acceleration/ retardation)
Area enclosed by a velocity-time curve gives _____ of the body.
v-t graph for uniform velocity is _____to time axis.
Plot a distance-time graph for the following data and state the type of motion.
| Time | |||||||
| Position |
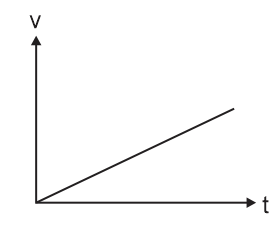
Draw a velocity-time graph to represent uniform motion.
What does area under a velocity-time graph signify?
The distance time graph is a straight line parallel to X-axis. What type of motion is shown here?
What will the v-t curve for a car parked on roadside look like?
Draw a velocity time graph for an object in uniform motion. Show that the slope of velocity-time gives acceleration of the object.
An object is moving along a straight line with uniform acceleration. The following table gives the velocity of the object at various instants Time
| Time | |||||||
| Velocity |
Plot the graph. From the graph, calculate the distance covered in the last .


